
Municipal bonds offer several features, and many investors find them to be a great fit for the fixed income portion of their portfolios. It is easy to add some simple structure to your portfolio to optimize dollars in uncertain interest rate environments. With a little patience, you can also find bonds that will fit together to generate consistent monthly cash flow. By selecting different issuers across your respective state, you can also diversify your holdings. Let’s look a sample South Carolina municipal ladder I put together for you (these are actual bonds offered by one of my dealers, but this is NOT an offering of securities):
25M LEXINGTON ONE SCH FACS CORP S SCH PUR REV BDS 5% DUE 12/01/2014
30M DORCHESTER CNTY S C SCH DIST N GO REF BDS 4% DUE 03/01/2015
25M BEAUFORT CNTY S C REF GO BDS 5% DUE 02/01/2016
50M GREENVILLE CNTY S C GO REF BDS 2% DUE 04/01/2017
30M RICHLAND CNTY S C SCH DIST NO GO BDS 4% DUE 05/01/2018
30M BERKELEY CNTY S C SCH DIST REF GO BDS 5% DUE 01/15/2019
The first chart below shows the monthly cash flow from the portfolio, the second shows the principal amount maturing each year, and the pie charts break down the overall ratings and maturity dates.
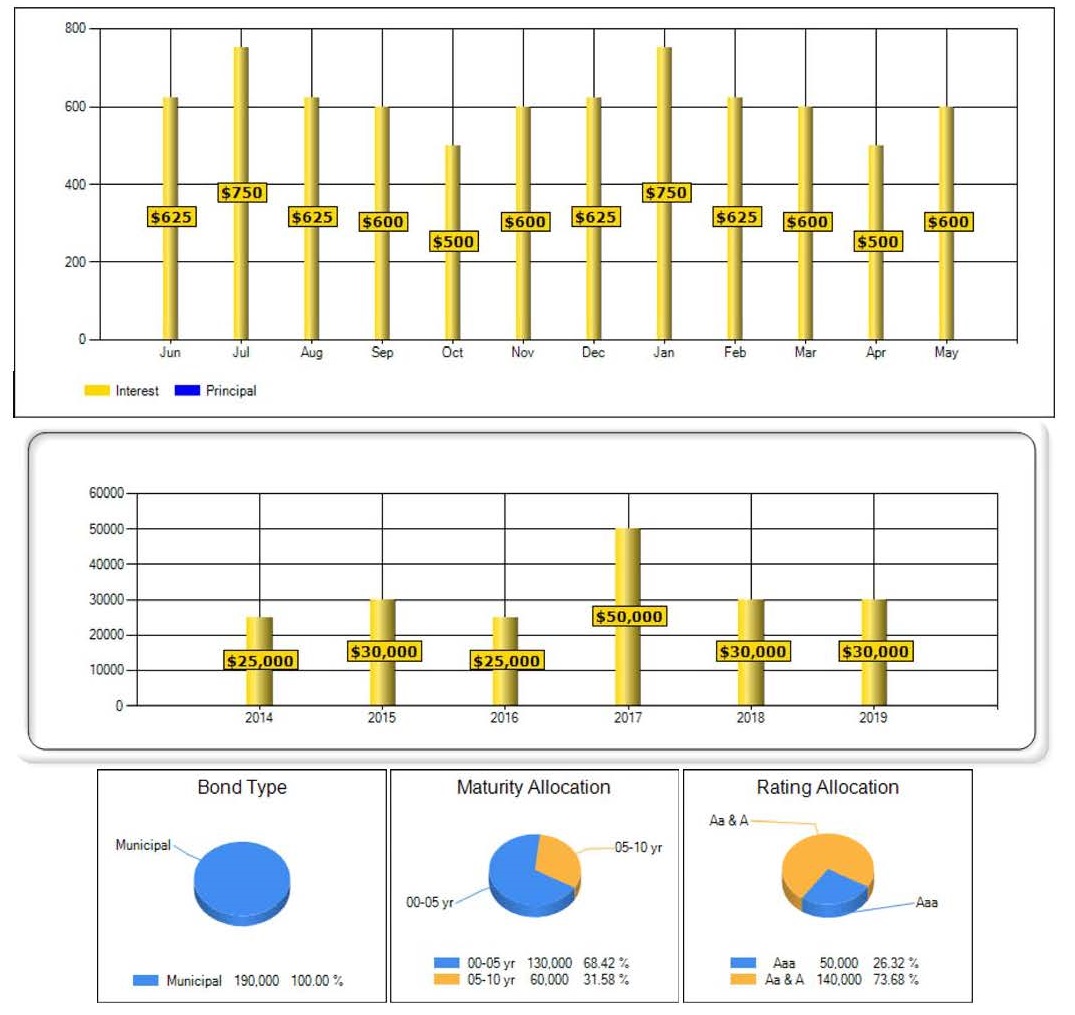
The total par value of this portfolio is $190,000, but because the coupon rates are higher than prevailing market rates, the dollar cost is $207,230. The average duration (please see my previous article defining duration) is quite low at 3.057 for all six bonds. In 2014 when the first bond returns principle, the monies will be reinvested into another South Carolina municipal bond maturing in 2020 at the far end of the ladder, and so forth going forward each year. This strategy gives you the opportunity to, over time, obtain higher yields to maturity while having funds coming due each year for liquidity purposes. Structure for the fixed income portion of your portfolio is just as important as structuring your equity holdings.
© 2013 Pawleys Investment Advisors, LLC. All rights reserved.
